Tehri Dam, Uttarakhand, India
Our first run. It checked that our processing works from start to finish before we did a full study. It used ready-made, low-detail satellite products from the COMET-LiCSAR service and a simple version of our method.
Rough and not checked
This run only tests the method. It makes no claim that the dam is moving. Most of the up-and-down swing in the chart, about ±30 mm, follows the seasons. That is most likely weather affecting the signal, not the structure moving.
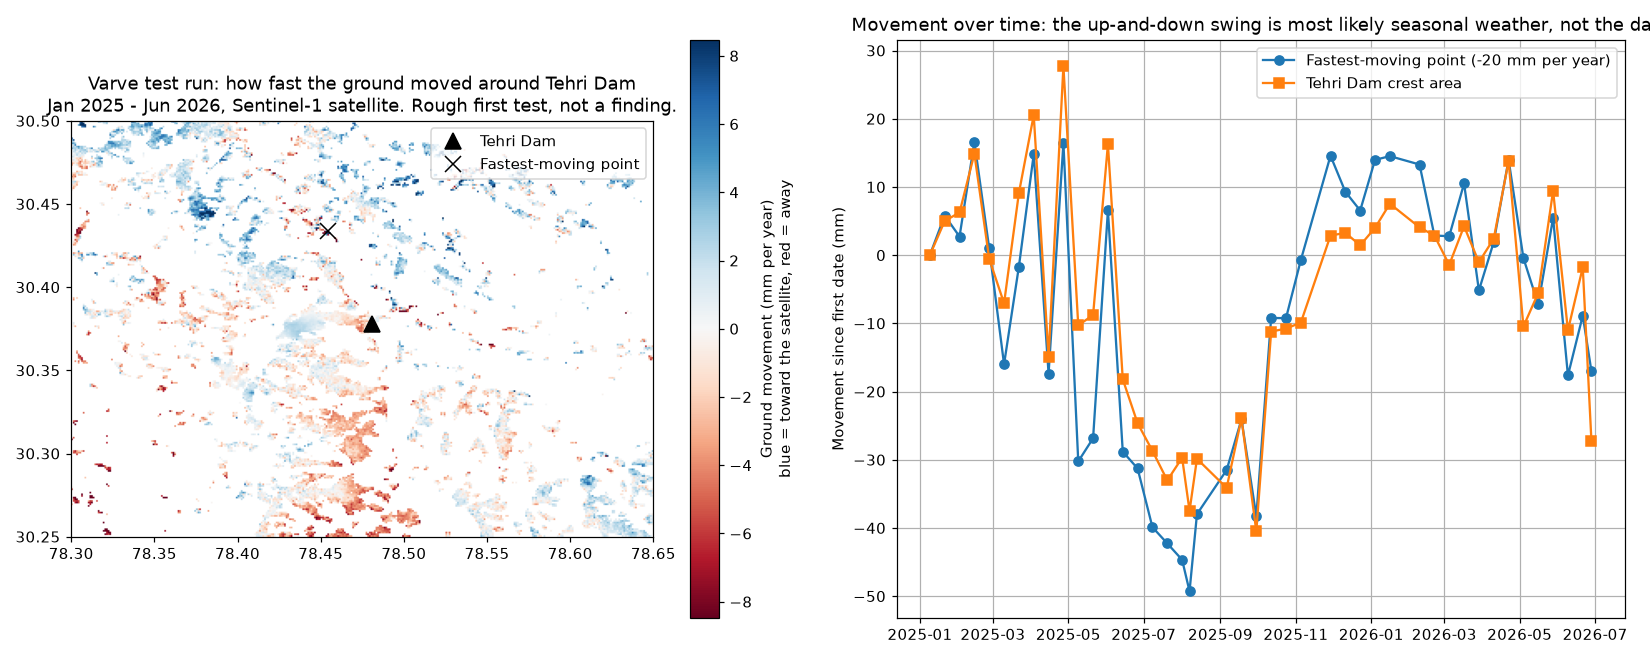
What the test taught us
- Weather is the biggest problem in mountain valleys. Steep slopes and monsoon moisture create seasonal swings as big as real movement. Correcting for weather is essential.
- Ready-made products are a quick first look, not an answer. They are good enough to test our setup, but too coarse to monitor a structure.
- Dams need sharper, targeted processing. Measuring the crest and face needs full-detail, point-by-point processing. That is the approach behind the Dalli-Rajhara case study.
Source images: COMET-LiCSAR (contains modified Copernicus Sentinel data 2025–2026).