Spot sinking or shifting ground early, across your whole site.
Varve shows where the ground is moving at mines, tailings dams, water dams, roads, rail and pipelines. We measure it from satellite images taken every few days, with records back to 2015. There is nothing to install on site.
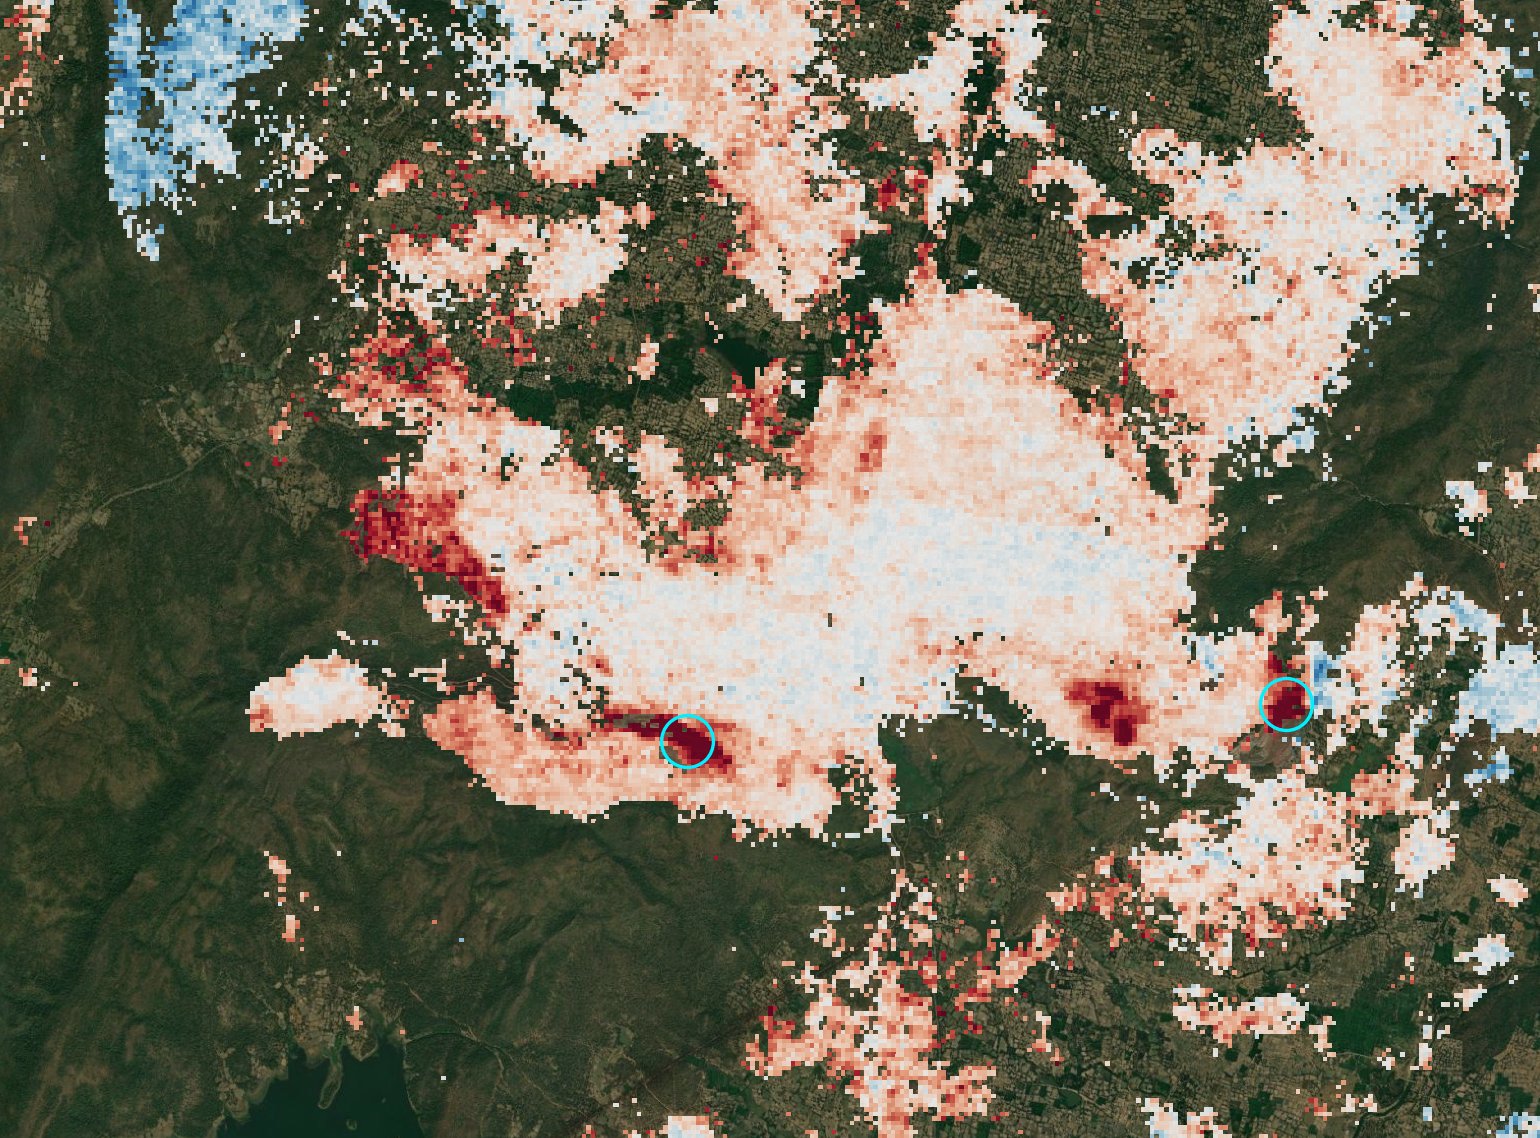
Four things you get for each site
Each one says how sure we are, and comes in files that open in your mapping software or Google Earth.
Movement map
Your whole site and its surroundings, showing which areas are moving and how fast, in millimetres a year.
GeoTIFF · Google Earth · PDF
Movement over time
A chart for each point you care about. See when movement started, whether it is speeding up, and whether it follows rain or mining work.
Spreadsheet · charts
Hotspot report
The areas moving more than normal, ranked, with a plain note on each and what to check on the ground.
PDF · shapefile
Site history back to 2015
Up to ten years of past movement from the satellite archive. Useful for baselines, incident reviews, permits and due diligence.
Map · charts · report
Where it helps
Open-pit and underground mines
Pit walls, waste dumps, haul roads and ground above underground workings. Know where to point your slope radar and survey crews.
Tailings dams
Settling and shifting on the embankment, the abutments and the ground around them. Adds evidence to your surveillance programme.
Water dams and levees
How crests and slopes behave over the years, including the long stretches with no instruments.
Rail, roads and pipelines
Check hundreds of kilometres for sinking ground, landslides and heave, then send inspection crews where it is moving.
Start with one site. It's free.
- Send us your site
A map file (KML or shapefile) or coordinates. Tell us what the asset is and which points you already monitor.
- Get your free site history
We go back through the satellite archive and send you a movement map, charts for your points and a short note on any hotspots.
- Keep watching, if it helps
We update after each new satellite pass and flag any movement beyond the limits you set.
What to expect. A radar satellite passes over your site every 6–12 days. By comparing its images, a method called InSAR, we measure how far the ground moved toward or away from the satellite. It shows trends. It is not a real-time alarm. Thick vegetation, water and freshly dug ground can give no reading, so always check results against your own instruments. We supply the data and our reading of it. Engineering judgement and sign-off stay with your team.
Read the full limits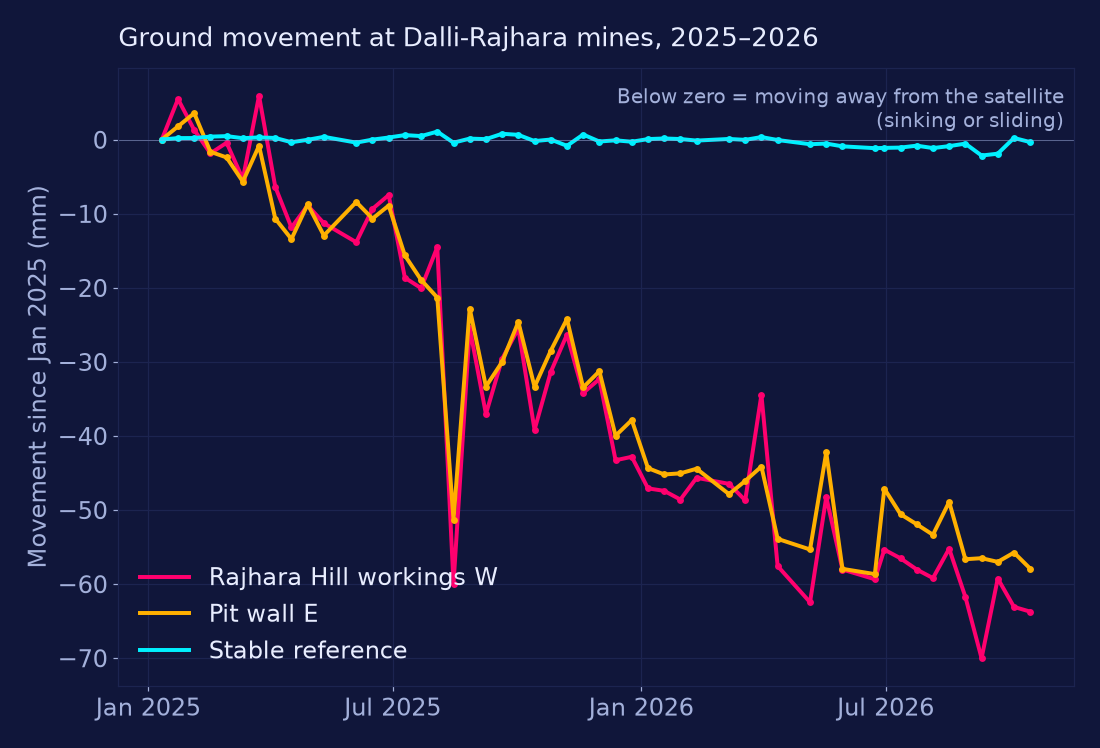
Dalli-Rajhara iron-ore mines and tailings dam, India
A site history built only from public satellite images, without visiting the site. It found two small areas on the mine workings moving steadily, about 35–40 mm a year. It also says plainly what the data could not show.
Send us a site
Tell us what the asset is and where it is. We'll send you a free movement history.
vyom@mitchi.xyzVyom, Chief of Staff, Varve