Dalli-Rajhara open-pit mines & Hitkassa tailings dam
A worked example over a working iron-ore mine complex in Balod, Chhattisgarh, India. We used only public satellite images. There was no site visit and no data from the operator. Prepared 25 Oct 2026. We picked this site because it has both steep pit walls and a tailings dam, the two things the method most needs to handle well.
This is not an engineering assessment, and it says nothing about whether the site is safe. The numbers below are movements measured from satellite, with their uncertainty stated. They need checking against the operator's own survey data.
What we looked at
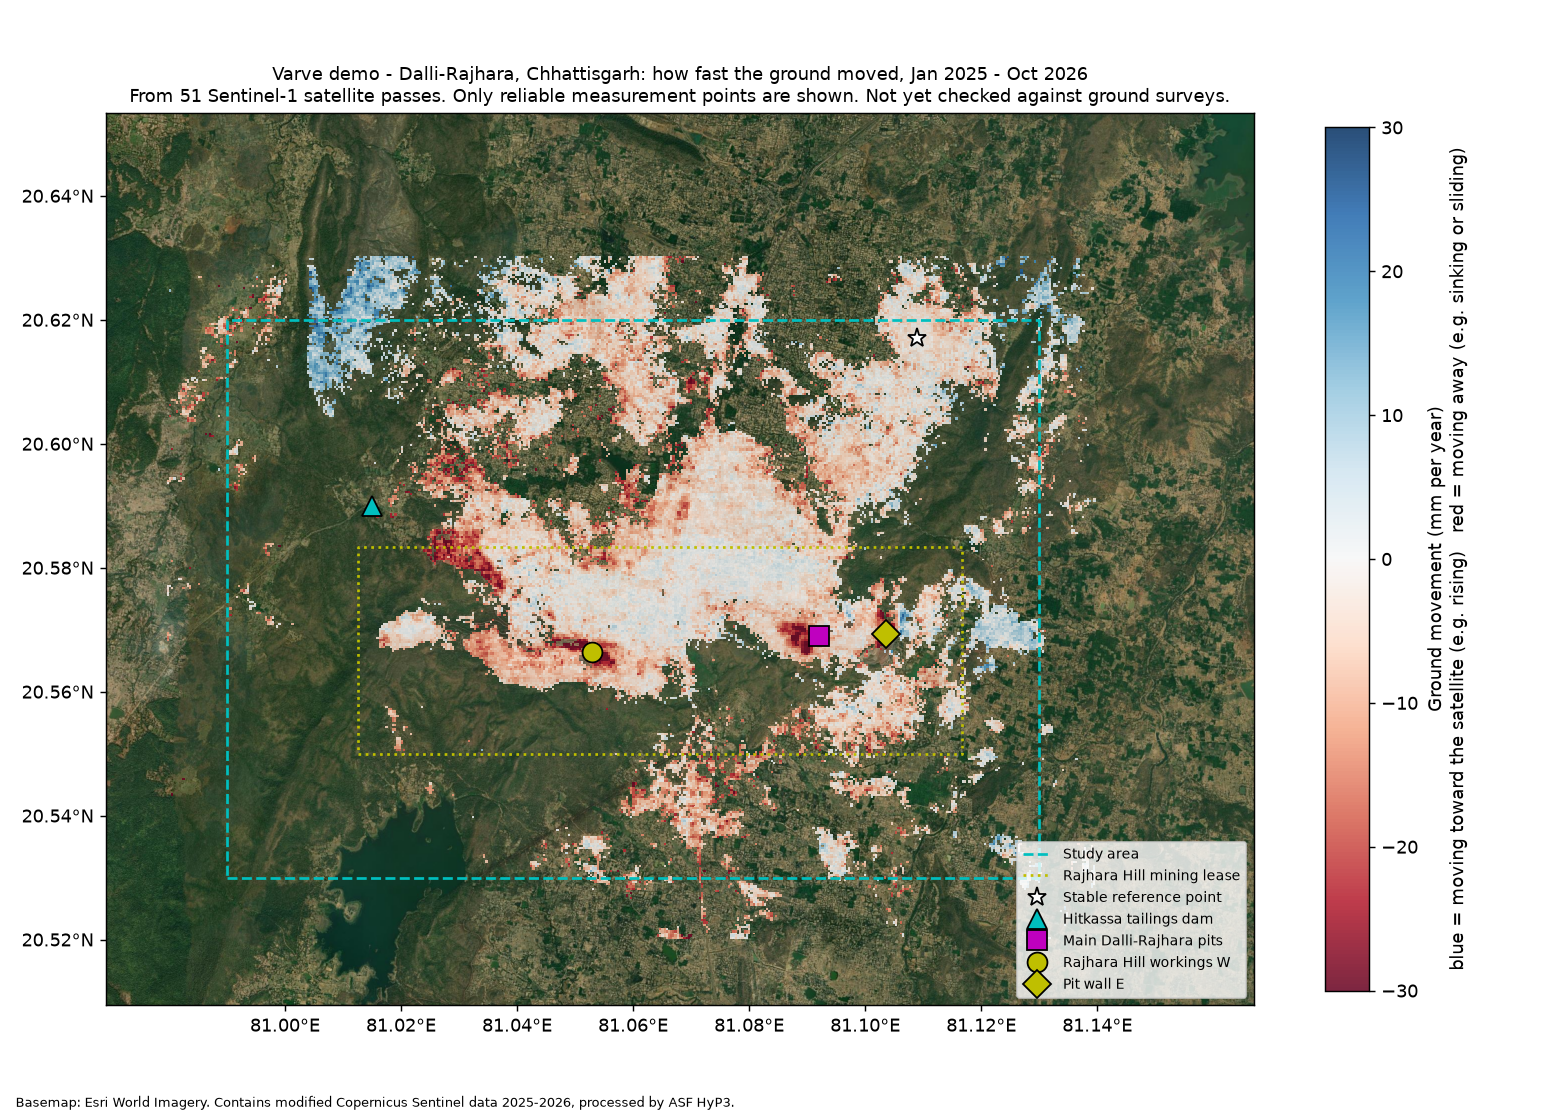
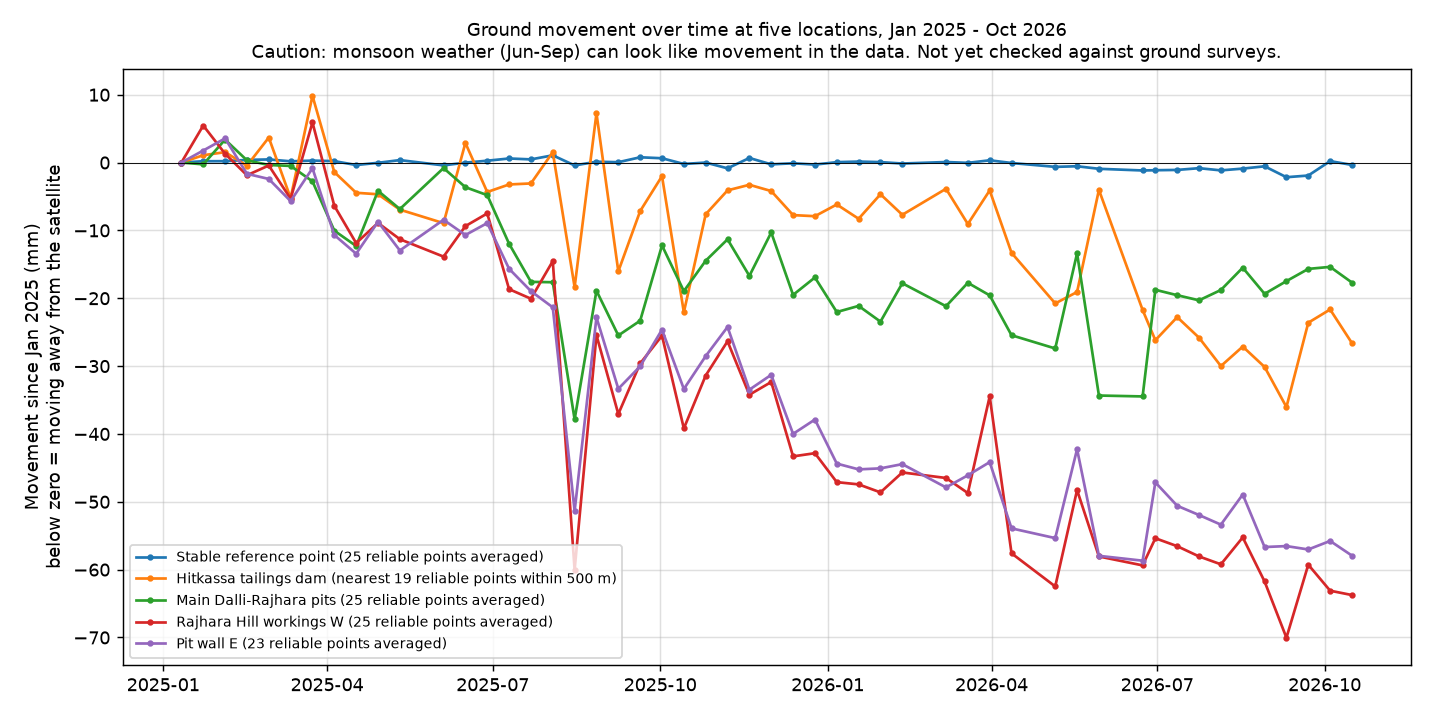
How much each location moved
Negative numbers mean moving away from the satellite. All movement is measured against a stable point about 5–6 km from the mine.
| Location | mm a year | Total mm, 21 months | What it means |
|---|---|---|---|
| Rajhara Hill workings W 20.566°N 81.053°E | −40 | −64 | Check Clearly above background noise, steady in both years |
| Pit wall E 20.569°N 81.104°E | −36 | −58 | Check Clearly above background noise |
| Main Dalli-Rajhara pits 20.569°N 81.092°E | −11 | −18 | Too small Can't be told apart from noise |
| Hitkassa tailings dam area* | −16 | −27 | Too small No reading on the dam wall itself |
| Stable reference point 20.617°N 81.109°E | −0.8 | −0.3 | Stable Zero by definition |
Background noise: on ground far from the mine that should be still, readings scatter by about ±8 mm a year, and most fall between −16 and +11 mm a year. So only movement faster than about 16–20 mm a year clearly stands out.
*The satellite got no reliable reading on the Hitkassa dam wall itself. The value shown is the average of 19 reliable points within 500 m, so it does not describe the dam crest.
Overall, 34% of the study area and 49% of the mining lease gave reliable readings.
Conclusion: two small areas on the Rajhara Hill workings have moved steadily, about 35–40 mm a year. They are worth checking against the mine's survey data. This run says nothing reliable about the Hitkassa dam.
What this study cannot tell you
- Not checked on the ground. We had no survey prisms, piezometers, GPS or slope-radar data to compare against.
- Only one viewing angle. The satellite sees this site from one direction only, so we can't separate up-down movement from sideways movement. Pit walls often move mostly sideways.
- Mining itself can look like movement. Digging, dumping and haul-road work change the surface. A "moving" area may be material that was moved, not unstable ground.
- No reading on the Hitkassa dam wall. At this level of detail the dam wall gives no reliable signal. Small metal reflectors fixed to the wall, or sharper processing, would fix this.
- Some noise remains. Moisture in the air, mainly during the monsoon, still affects some readings. On stable ground the scatter is about 8 mm a year. We did not apply the extra weather corrections a full project would use.
- A second satellite did not help yet. We compared with NASA and ISRO's new NISAR satellite for Jun–Oct 2026. Its early data is still provisional, has a gap from Jan to Jun 2026 and did not agree with our main results, so we did not use it.
Limits of satellite measurement in general
- It is not real-time. There is one reading per satellite pass, every 6–12 days. It shows trends; it cannot warn of a collapse in progress. Ground-based slope radar is the tool for that.
- It measures one direction. It sees movement toward or away from the satellite. Splitting that into up-down and sideways needs views from two directions.
- Some ground gives no reading. Thick vegetation, water, snow and freshly dug or dumped ground lose the signal. Small reflectors can fill critical gaps.
- It needs checking. Compare results with your survey, prism or GPS data before acting on them.
What a full project would add
- Sharper maps (20 m), plus point-by-point readings on dam crests and structures
- Weather corrections from global weather data, and extra quality checks
- A second viewing direction, for example from NISAR, to split movement into up-down and east-west
- Low-cost metal reflectors on embankments where the satellite gets no reading
- Checks against the operator's survey, prism or GPS data
- A longer movement history, back to 2016, and an automatic alert after each satellite pass, with limits agreed with the geotechnical team
Get a free history of your site
Technical details, for remote-sensing specialists
- Radar data
- Copernicus Sentinel-1, C-band (5.5 cm), relative orbit 92 descending, bursts 092_196415_IW2 + 092_196416_IW2
- Interferograms
- 147 pairs (each date with the next 3), NASA/ASF HyP3, ISCE2 multi-burst, 40 m pixels
- Time series
- MintPy 1.6.4 small-baseline inversion; troposphere corrected by phase–elevation correlation; DEM-error correction; pixels with temporal coherence < 0.7 masked
- Reference
- Coherent ground at 20.617°N 81.109°E
- Area of interest
- 80.99–81.13°E, 20.53–20.62°N
- Noise
- Formal velocity σ ≈ 1.5 mm/yr; empirical 1σ ≈ 7.9 mm/yr on coherent ground > 3 km from the workings; no ERA5/GACOS correction or unwrapping-error correction; phase-closure ambiguities in parts of the workings
- Cross-check
- NISAR L-band GUNW (provisional), Jun–Oct 2026, ionosphere-corrected; 20–50 mm residual ramps, not used
Contains modified Copernicus Sentinel data 2025–2026 processed by ASF HyP3 (NASA). NISAR data courtesy NASA/ISRO via ASF DAAC (provisional). Basemap: Esri World Imagery. Software: ISCE2 (via HyP3), MintPy (Yunjun et al., 2019).